To evaluate the physiological changes related with age of all retinal layers thickness measurements in macular and peripapillary areas in healthy eyes.
Overview
Study Design
Cross-sectional study
# of Eyes/ Patients
• Total of 467 eyes from 467 healthy subjects. • Subjects were categorized into four age groups: 20–34 years (group 1), 35–49 years (group 2), 50–64 years (group 3), and 65–79 years (group 4)
Study Device
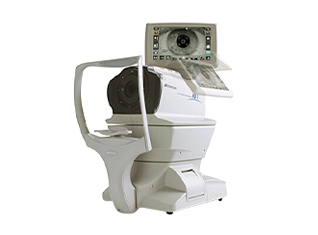
DRI Triton SS-OCT (Topcon, Tokyo, Japan)
Outcome Measures
• The mean and standard deviation of the thickness evolution of each segmented layer were measured. • Comparison between age groups was performed in four quadrants (temporal superior, temporal inferior, nasal superior, and nasal inferior) and four halves (superior, inferior, nasal, and temporal)
Results
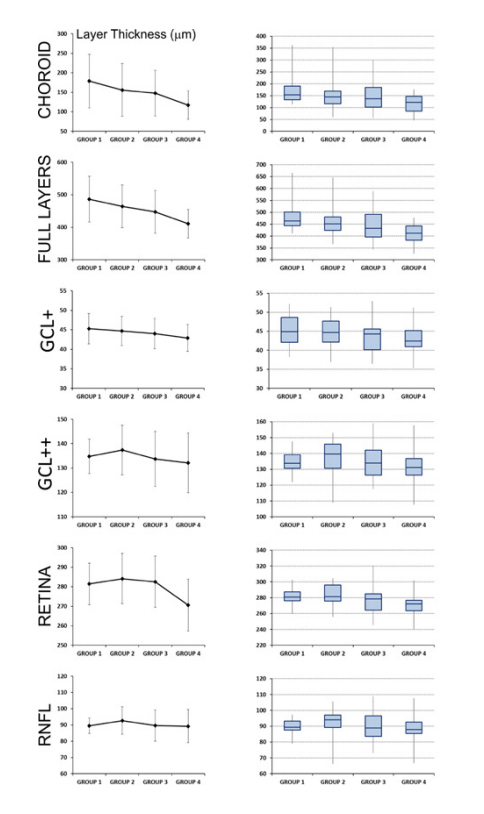
The most significant thinning of all retinal layers occurs particularly in the transition from group 2 to group 3, especially in the temporal superior quadrant at RNFL, GCL++ and retinal layers (p<0.001).
IMOvifa reduced measurement time by
39%
FIGURE 3
FIGURE 3.
Representation of mean and standard deviation for each layer measured by Triton optical coherence tomography, for the four age groups.
On the left column, the mean and standard deviation are shown for each layer and age group. On the right column, the quartiles are plotted to show
data dispersion and the presence of outliers.
Adapted from PLoS One. 2020 Oct 14;15(10):e0240441. DOI: 10.1371/journal.pone.0240441
Conclusions
• Findings suggest that there is a progressive and physiological thinning of all retinal layers from the third decade of life. • This study may be a base to build a normative database that allows health personnel to improve the interpretation of retinal measurements, even with a color scale similar to that of one used by most OCT devices. This is an important limitation of the current Triton software because we can visualize numerous measurements of all retinal layers, but ophthalmologists do not know if these values are normal for the age of each subject or patient.